Patterns in Los Angeles Traffic Collisions
In this series of posts, I explore the Los Angeles Traffic Collision Data dataset published by the City of Los Angeles, which contains almost 600,000 observations of reported traffic collisions from 2010 to present.
The Question
As an Angeleno, I’ve always wondered: How frequently do accidents occur anyway? When do they tend to occur?
The Dataset and the Approach
The Los Angeles Traffic Collision Data from 2010 to Present is a rich dataset published by the City of Los Angeles with a lot of useful information–not only time and location, but MO Codes, which categorize the incident according to an arcane system of hundreds of codes.
Since I’m interested in looking at patterns over various time intervals, I’m mainly concerned with just two features from this dataset: Date Occurred and Time Occurred. To generage the following visualizations, I started by parsing these two fields into a pd.DateTime object, then I grouped the DataFrame by this new field and counted the number of collisions per date/time. At that point, it’s smooth sailing–just a matter of resampling this new, minimal dataframe by whatever interval I needed.
Here’s some takeaways:
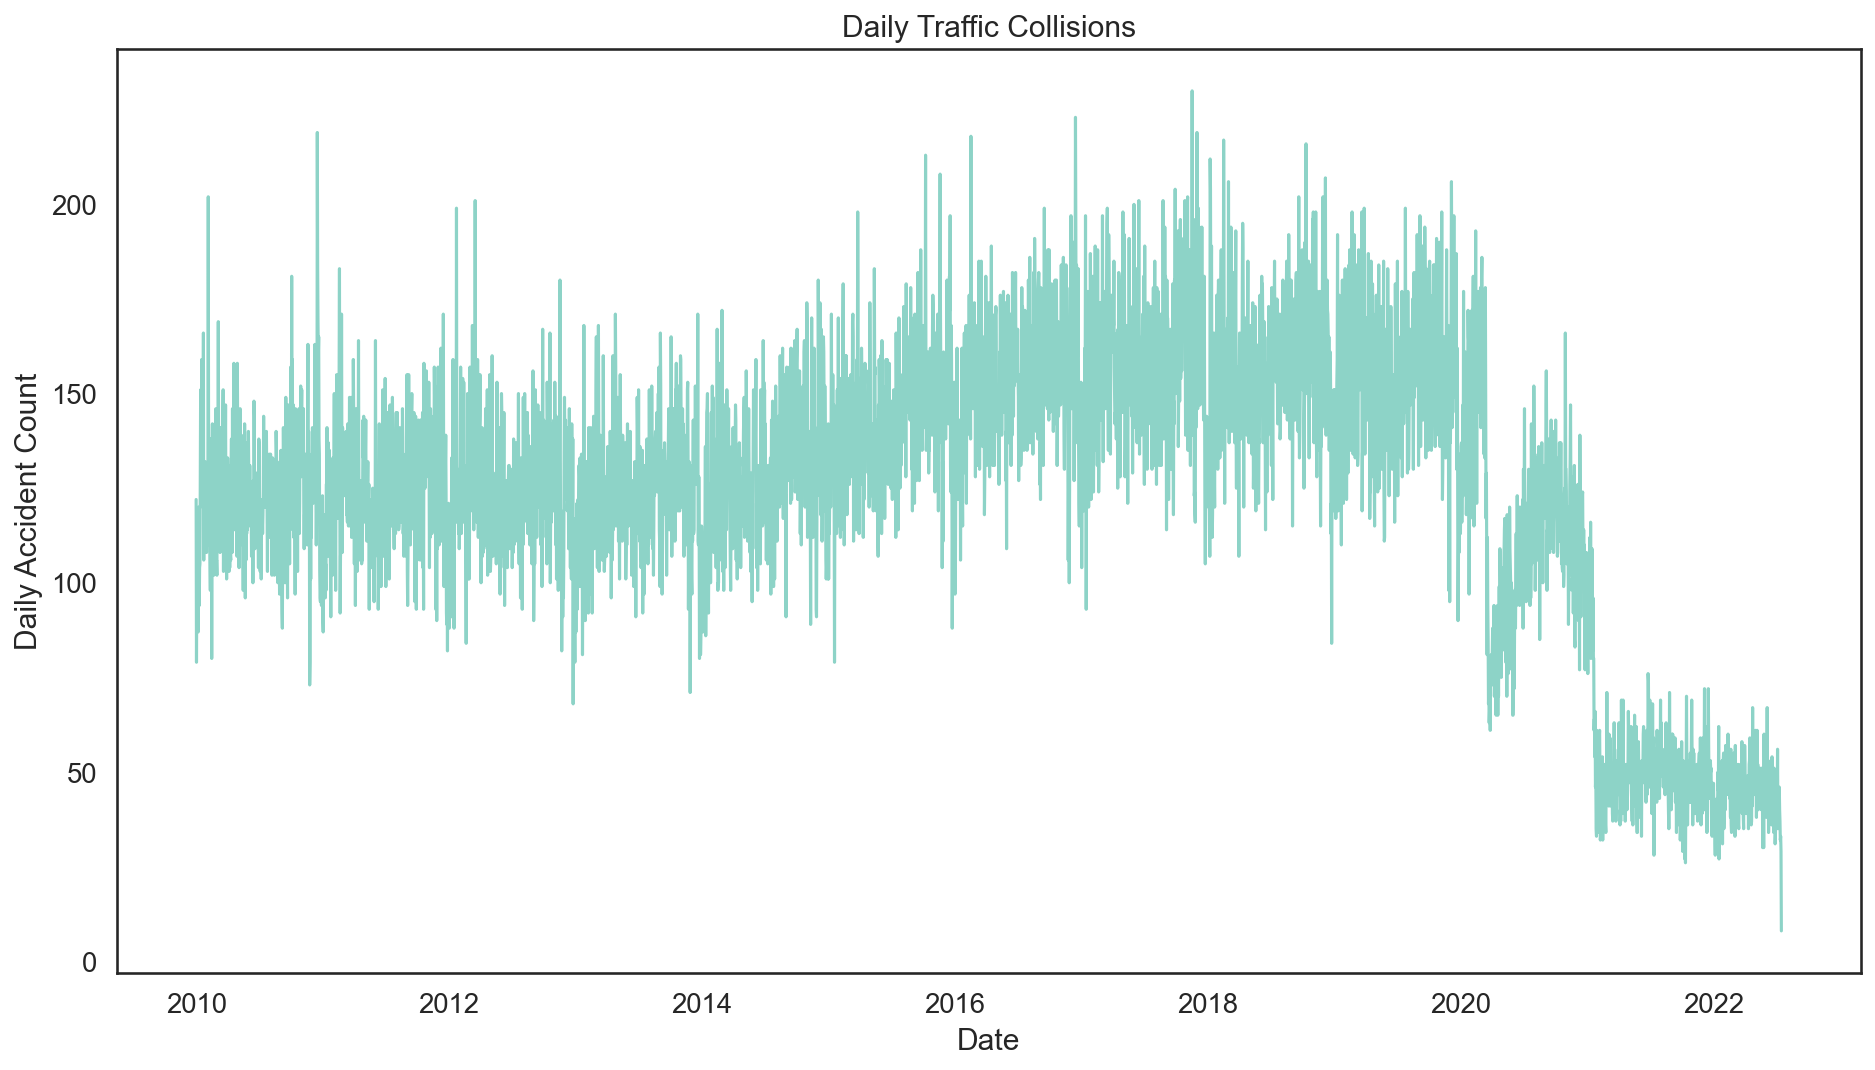
1. Most days there are around 100–150 collisions, but this number was on the rise until Covid

2. That’s somewhere around 3,500-5,000 collisions per month in pre-Covid days

3. Collisions occur most on Fridays, least on Sundays

Now we’re starting to see some patterns. As any given week progresses, there are an increasing number of accidents per day, on average, with a dramatic spike on Fridays. Saturdays are significantly better, though still worse than Fridays, and Sundays see the lowest number of accidents.
4. Collisions occur most during rush hour

Frankly this isn’t what I expected at first. I thought we’d see a higher incidence of accidents at night, but instead we see an early spike with morning rush hour at around 8:00 and then an evening rush hour spike at about 5:00pm. But on second though, this makes perfect sense, since we’re looking at total accidents (rather than accidents as a proportion of cars on the road, say), so in fact we would expect there to be more crashes when more people are driving.
Combined with the previous chart, we can imagine the TGIF situation as Angelenos rush home for the weekend after a long week at work. Let’s check.
5. The rush hour thesis holds for weekdays, not weekends

We can immediately intuit a high level of correlation in average hourly collisions on weekdays, with Friday’s pattern being slightly anomalous. This confirms what we already discovered: a morning rush hour peak in accidents that gradually builds to a higher peak corresponding to the afternoon rush hour, which any Angeleno will tell you is a much wider window than the AM rush.
Meanwhile, weekend patterns also seem to correlate closely and point to a different condition: a spike in early morning accidents (presumably after bars let out), a morning lull when we would ordinarily see a weekday rush-hour spike, and a slow increase until the late afternoon.
6. Weekday trends are closely correlated, as are weekend trends

Yes indeed: a very high level of correlation between weekday days and a slightly lower but still high correlation between weekend days, plus some moderate correlation between Fridays and Saturdays.
7. Weekend and weekday patterns look quite different

8. Historically most collisions occur on Halloween Eve and fewest on Christmas Day


Halloween Eve (and the day after Halloween, interestingly) are the main culprits. October 1st is a mystery to me at this point. And as for 11/21 and 12/17? I wonder if these dates have historically fallen on Fridays (the worst day of the week, collisions-wise), and are made even worst by the conjunction of the holiday season and the shorter/darker days.
As for the days with fewest collisions historically? No surprises here: Christmas day and the days right after are especially low, most likely because people are home with family and not out and about or commuting to work.
Takeaways
This gives us a good idea of some very basic patterns. If we wanted to go into more detail, I’d want to add some additional features to this dataset: for example, whether or not a given day is a federal holidays, whether or not the collision occurred during daylight hours, etc. It would also be useful to normalize the accident rate so that we’re not looking at total volume of collisions but the rate of collisions per, say, 1,000 cars on the road, but so far I haven’t been able to find a dataset with widespread traffic volume data.
